 Roost
RoostSee where work gets stuck.
Flow metrics for boards, change metrics for Flow, and reliability metrics for Incidents. One date range across all three, computed from the record.
Board
Cycle time in percentiles, throughput, aging work in progress, and a Monte Carlo forecast for when the current batch lands.
Flow
Change volume by type, success and failure rates, and the approval gate where requests wait longest.
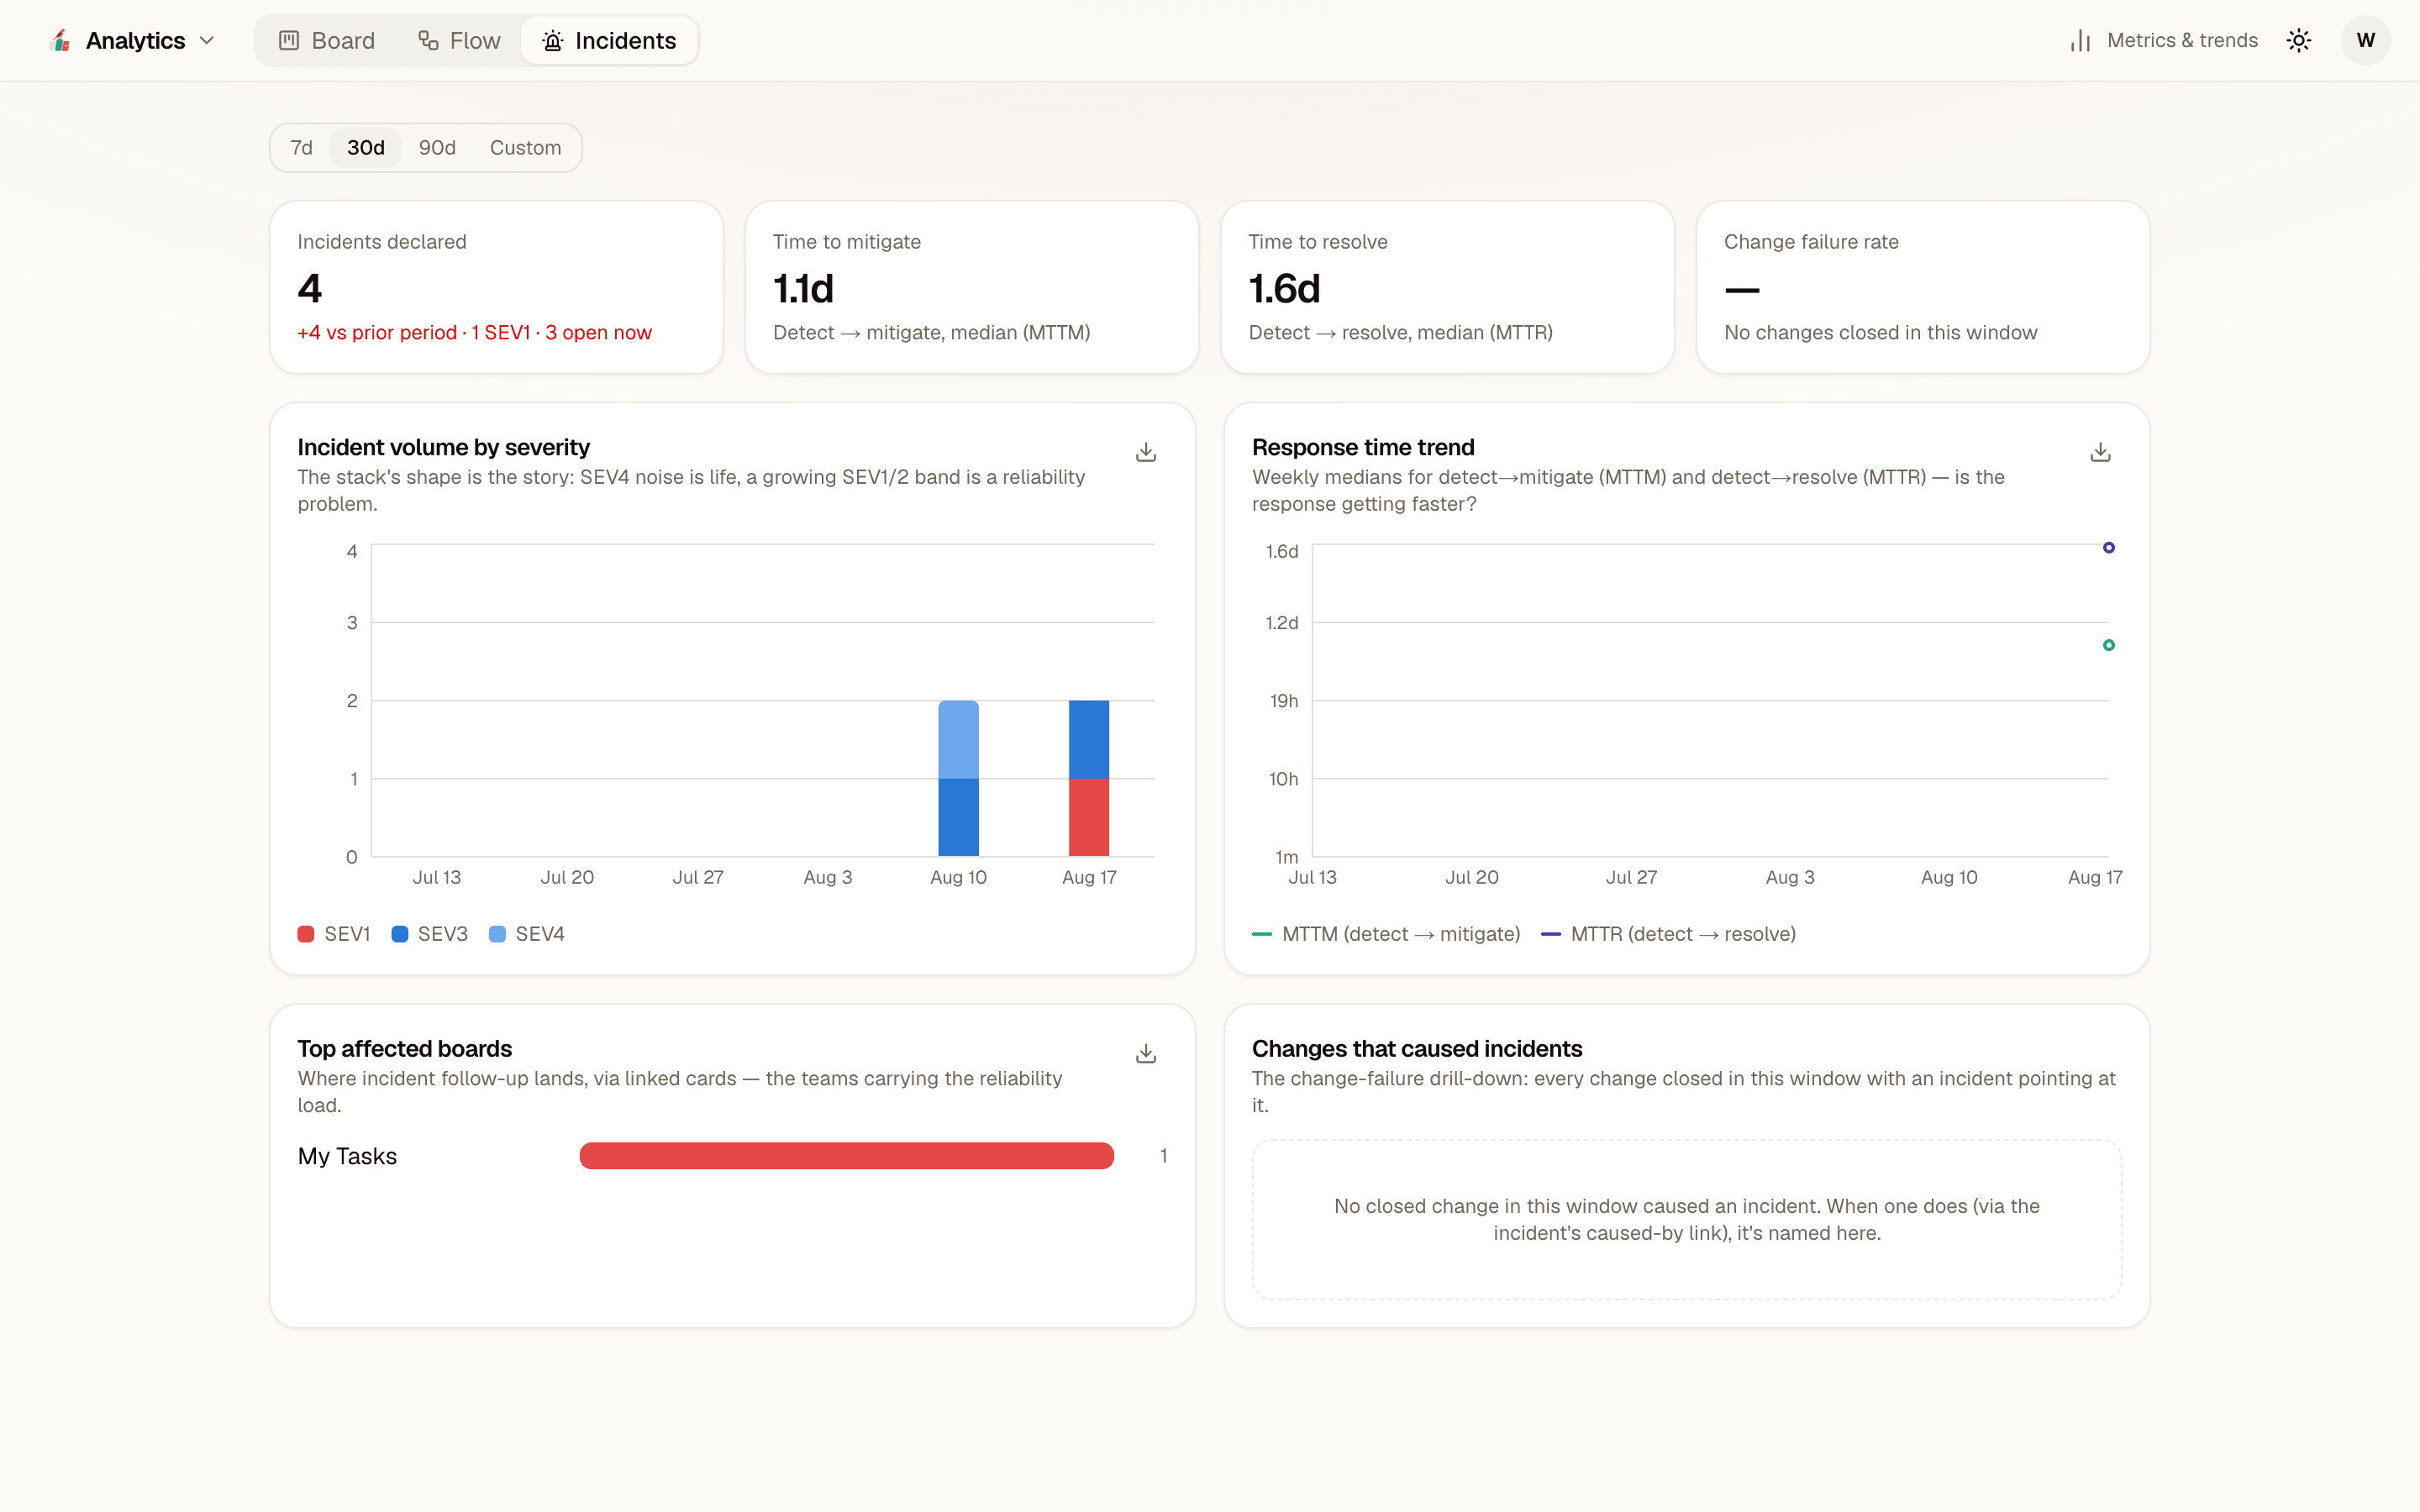
Incidents
Volume by severity, median time to mitigate and resolve, the boards carrying the follow-up work, and the changes that caused incidents.
Cycle time in percentiles
Median, 85th, and 95th percentile, so one slow card does not hide behind an average.
Aging WIP, the unstick list
Every card in progress ranked by how long it has sat there, with the column it is stuck in.
Monte Carlo forecasting
A forecast for the current backlog drawn from your own throughput history, with the confidence stated.
Find the approval bottleneck
Time spent at each gate across every change, so the slow reviewer is a fact and not a rumor.
Rejection and rework, verbatim
Every rejection reason, in the words the approver used, grouped by workflow step.
Reliability, measured
MTTM and MTTR are medians of real milestone timestamps. Change failure rate counts changes linked to incidents, from the audit log.
Filters that live in the URL
Date range, board, and view are part of the address. Share a link and the other person sees the same numbers.
CSV export per widget
Every chart has the rows behind it one click away.
Answer “where is it stuck?” with numbers.
Analytics is the page you land on after sign-in. Roost is in beta and invite-only.